retroRunner
A running dashboard and AI coach I built on my own Garmin data, because I didn't want to keep paying for Strava.
One command syncs my runs, and the dashboard shows them the way I like. The Claude coach goes over my week with me and pushes next week's runs to my watch.
- ~3weeks to build, an hour or two at a time
- 1command to sync
- 17calculations, each tested
- $15a month I don't pay Strava
- Tuesday felt hard, so keep the next easy run easy
- Long run held pace to the end
- Next week holds the same volume
02The project
The problem
I started on Strava, and the features I wanted were on the paid plan, about $15 a month. When I got a Garmin watch, a friend told me about a library that lets you download your own Garmin data directly.
After that I didn’t want to keep paying for Strava, so I decided to just make my own thing.
Why build my own
I wanted something on my computer I could come back to after a run that just shows the data the way I think helps me most. You can kind of tell from the rest of it, like how the journal works with the coach, how I wrote the coach instructions and which data points made it onto the dashboard.
Part of it is that I just love seeing data. Having my runs laid out like that actually motivates me to get out and exercise.
The main thing is it’s simple. One command syncs everything, and workouts go straight to my watch. Strava and the other running apps charge for both. I rebuilt them with just my Claude subscription.
- Strava, paid plan
- Garmin's app
- A plain chat with Claude
- Build my own
How it works now
In a normal week I follow the plan the coach wrote the week before. I do my three runs and ask Claude to summarize them. Then it pushes next week’s runs to my watch.
The coach also keeps track of which plan I’m on. There’s an aerobic base block that runs all year, and a block for when I’m training for a half marathon, things like that. So it’s a lot more customized to what I need, and free, more or less.
I’m new-ish to running, but I know how to point AI to the right resources, so anything I did would probably have helped me improve anyway. After a near injury, though, it was nice to have some things reaffirmed. I wanted somewhere to talk things through and check how deliberate I should be. More often than not, it told me to slow down and really work with how I feel.
Mon to Sun
Run
Three runs on the watch, following last week's plan.
Who can step in: Me.
What’s in it
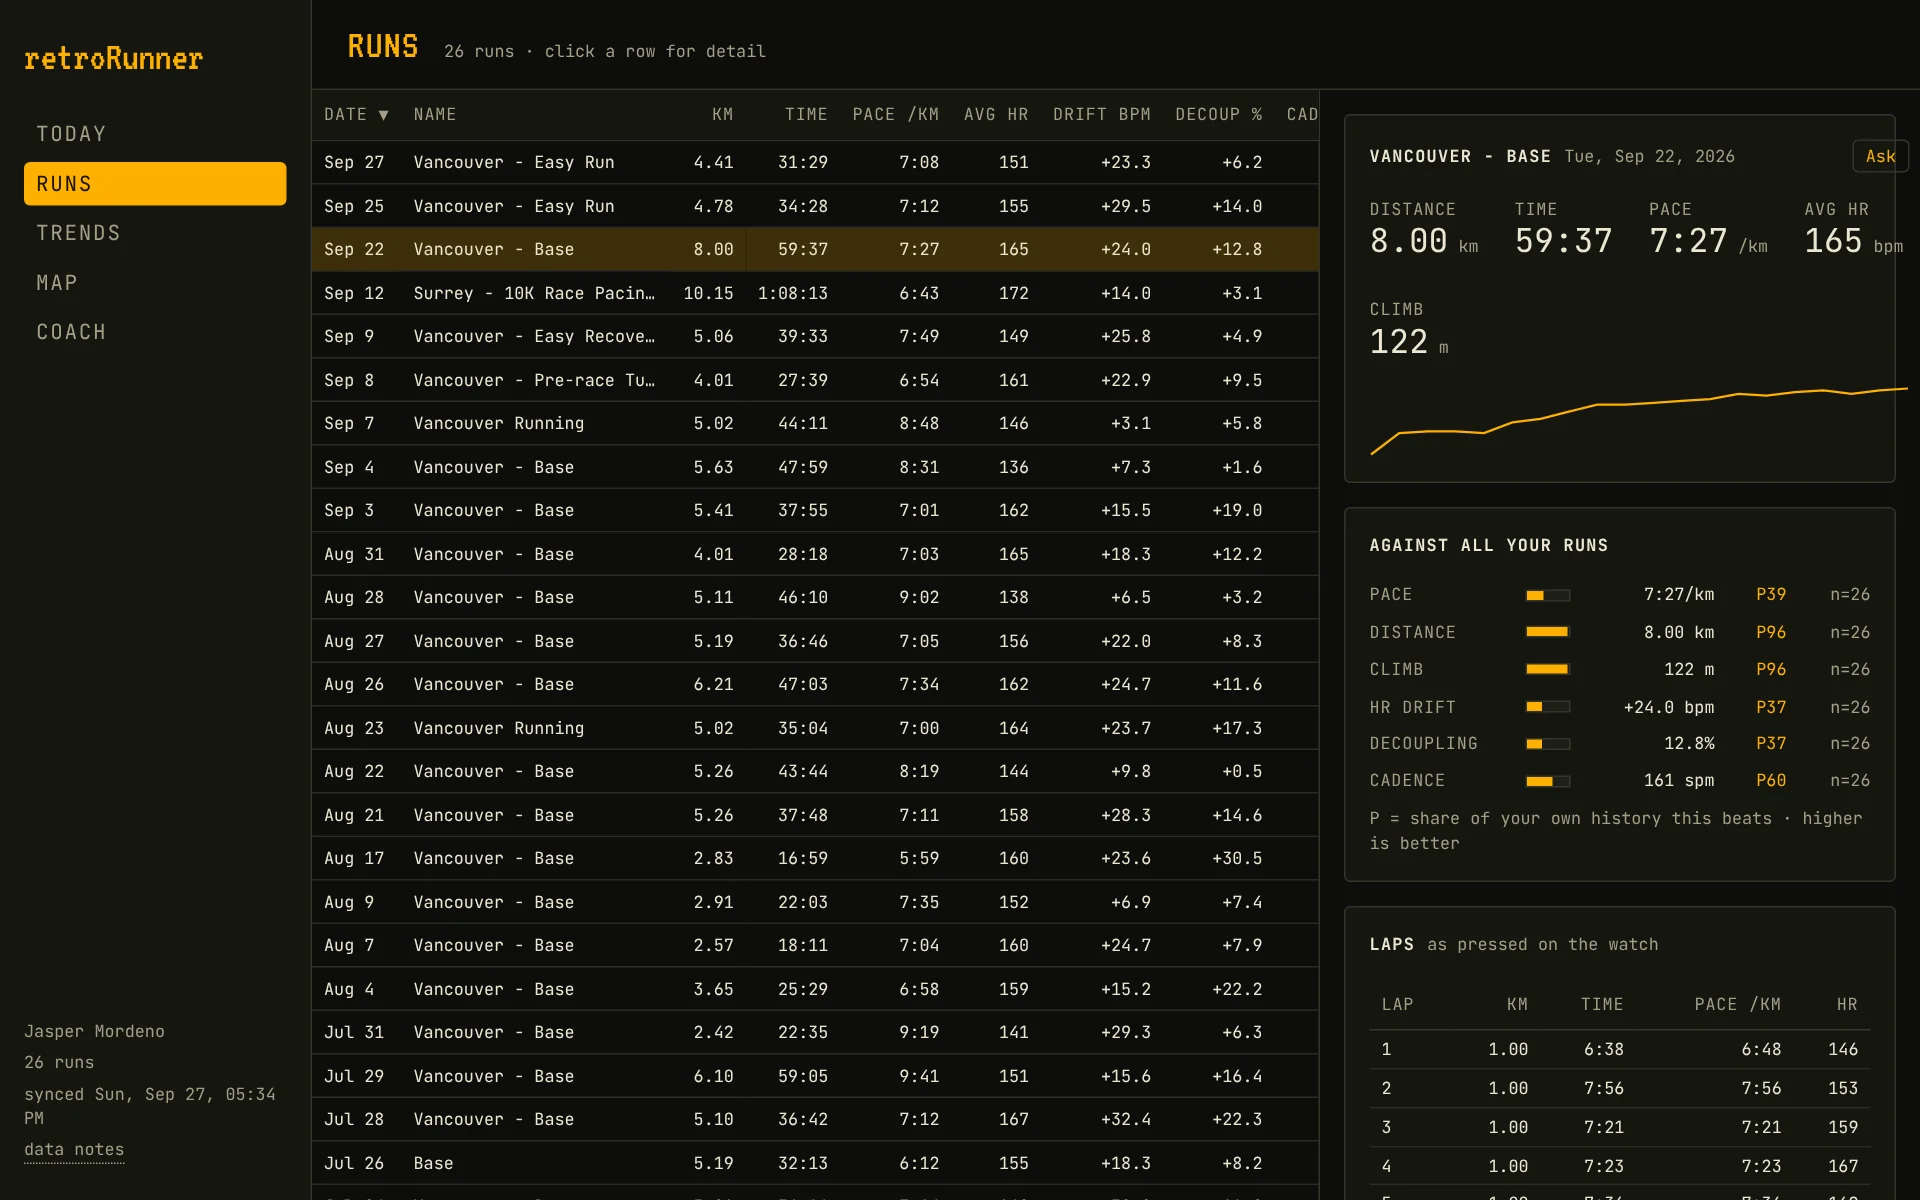
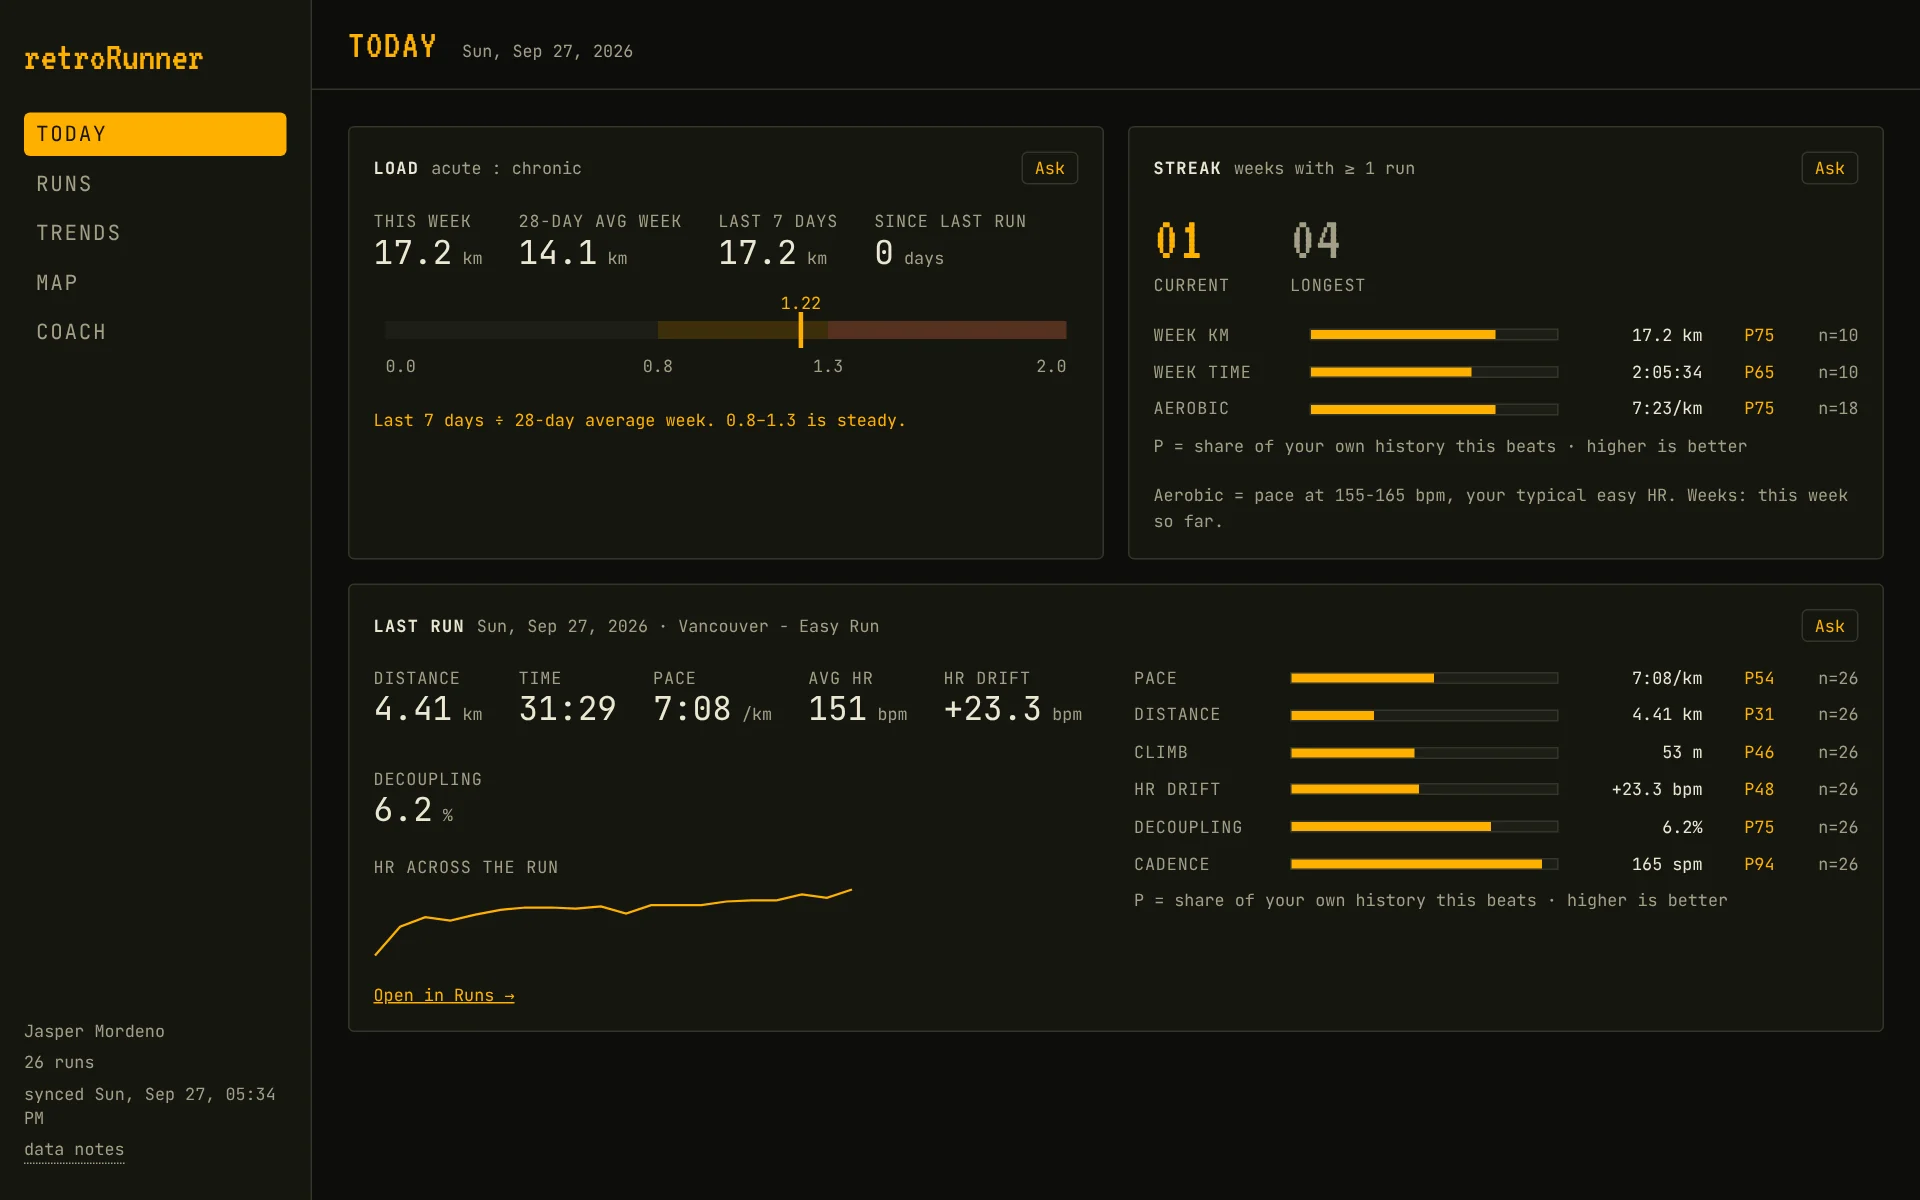
Today shows where my week’s at, and Runs lists every run with its laps. Trends has a calendar, training load and best efforts. Map has my routes, and Coach is the chat.
The whole thing has a retro feel, with a streak counter and percentile bars against my own history. When we redid the UI, each of those had to be tied to a real number with a label, or it came out.
Sample data. Tap a view to look around.
Todaysample data
RunsSat · long · 11.4 km
Trendssix weeks · Mon start
Mapserved locally
Coachactive block: base
How did this week go?
COACH> Three runs, volume on plan. Tuesday's easy run felt heavy, so keep the next one honest. Long run held pace to the end.
3 workouts ready · confirm to push
>
03Architecture
Where it started
It really just started as a way to summarize my runs and show what we could do with Claude design-wise. The first version synced from Strava, and then I just went around it and pulled from Garmin directly so I didn’t need the subscription.
Moving to Garmin meant re-architecting it. I thought through the architecture first and what the rebuild might need. Then we did it in phases, starting with the data and ending with a new frontend. The notes on where it started and how it got here are still in the repo.
The layout
It all runs locally on my laptop. A Python sync pulls my runs from Garmin. In the middle is a calculation library, and the dashboard and the coach both get their numbers from it. The coach is Claude through the Claude Code command line with a small set of tools, so it runs on my subscription.
Workouts go back the other way. The coach writes them and I confirm. Then they get checked and sent to Garmin, which puts them on my watch.
Hover a piece to see what it owns and what it can’t touch.
The libraries, and why
The Garmin library my friend pointed me to, garminconnect, is Python. It already did everything I needed, from reading runs to uploading workouts. So the sync is Python, and we kept the calculations in Python too so there’s only one version of each formula. The per-second data goes in SQLite, which Python can read out of the box.
The dashboard is React with Vite. Its charts are drawn by hand in SVG so they fit the retro look. The coach reaches the calculations through an MCP server, so it can use a new one as soon as we add it.
Keeping every second
This was the big one. I felt the coach wasn’t smart enough for what I needed, and part of the reason was the data. When we moved to Garmin, the plan assumed Garmin only gave summaries of each run, so the second-by-second data got dropped. It turns out Garmin sends about one reading a second for heart rate, pace, cadence, elevation and GPS.
We refactored how it stores data, and now every reading is kept in a local database on my laptop. A formula change just recalculates from what’s already there. The coach can also answer stuff like how kilometres three to seven went.
Following one week
Here’s one week, from a sync to the workouts on my watch.
I do my runs and the watch syncs them to Garmin.
One command pulls the new runs, every second of them, and writes them to the local store.
The calculation library works out each run's numbers from what's stored.
I ask the coach how the week went. Claude starts from my instructions, its memory and the run data.
Every number it uses comes from the library through its calculations tool. It never does the math itself.
It answers, then saves what we decided to the active training block.
It writes next week's workouts and they show up in the app for me to look over. Nothing goes out until I confirm.
Each workout is checked, kept to pace targets, and uploaded and scheduled on Garmin.
It gets sent to the watch, and it's there for my next run.
04Trust
Why it mattered
Well, it’s health data, but it’s a local only project, so I’m not really too concerned about it. I still think it’s good practice for every AI project.
The rules ended up being more about the coach getting things right. It’s planning my training, so I want its numbers to be real. I also want to be the one who says yes before anything goes to my watch.
The routes were an interesting one, even though I ignore them myself. A map of every run shows where you live, so they’re served from my laptop and never committed.
The rules
Tap a rule to see where it’s enforced.
05Working with Claude
Where I stepped in
The first prompt was very simple. I was like, hey, can you just build this running dashboard for me? I actually needed a lot more specifics than that. Since I was the user, most of my stepping in was filling those in and making sure it fit my daily life.
There were two big ones. The first was refactoring how it stores data so the coach could be smarter. The second was refactoring the UI so it was more useful for me. A few smaller ones came up along the way, like the coach doing its own math, or thinking it had saved things it hadn’t. After my race it also kept planning for a race I’d already run, because the goal was written into its instructions.
Examples
Tap a card to see what changed.
06Process
How we worked
It worked about the same as my other projects, including the WhatsApp one. I start with an architecture and a handful of features and iterate from there. Each phase got a written plan, and when we made a call someone might question later, we wrote down why.
The rule about where numbers come from sits at the top of the CLAUDE.md, so every session starts from it. Anything that touched Garmin got tried on my real account too.
Testing the UI
The UI bugs were an interesting one. The weekly volume bars were showing up 0px tall, and a change of zero showed as a red down arrow. Both of those got through review, so we built an audit that scores the UI with formulas.
It checks things like contrast, broken heights and alignment. It also checks whether a colour matches which way is actually good for that number. Every UI change runs it, and when a score goes up, that becomes the new bar to beat.
My thoughts
The build took about three weeks, and even that’s generous. Really it was an hour or two here and there, and not even every week. So it was relatively low input for high return.
I don’t pay for Strava anymore. My running has improved a lot too, and I think that has a lot to do with the motivation of seeing it all laid out.
Professionally
The hardest part was figuring out what I actually needed. I was the audience, so I could take it in any direction. Having that much choice made it surprisingly hard to decide. I talked to friends about what they take from their own training and pulled from what I liked in other apps.
If you’re building something like this, use it day to day and try to be objective about it. I kept coming back to one question. Would I actually pay for this if someone else made it, or am I only using it because I made it? I tried to make it so there’s no reason for me to go back to a paid app.
Personally
Picking through the Garmin and Strava libraries was really easy, and that’s what spurred my interest in this in the first place. Just because you can build it yourself doesn’t mean it should stay bare bones, though. It’s nice to really stretch your creative and technical side.